Dynamics of Behavioral Risk-Taking
Gamified behavioral assessments are widely adopted to screen and match candidates. However, providers rarely publish peer-reviewed evidence connecting game behavior to the constructs being inferred from it. This project addresses that gap by building a complete instrument for measuring behavioral risk-taking from scratch.
Working paper
A Dynamic-Hazard Balloon Task and an Exploratory Study of Behavioral Risk-Taking
Honors Seminar Report · Middle East Technical University, 2026. Advisor: Assoc. Prof. Dr. Gülşah Karakaya.
Read the paper (PDF)Introduction
The motivation behind this project is straightforward. Matching the right person to the right job matters, and good matching depends first on measuring the person well. In hiring, gamified behavioral assessments have become a widely used method for this. Digital platforms ask candidates to play neuroscience-inspired games and use the analyzed behavior to screen applicants. Observed behavior can be more informative than a self-report, and a short game can be deployed at scale without allocating too many resources. The firms that deploy these assessments report improved efficiency metrics, such as time-to-hire or retention. However, the platform providers rarely publish peer-reviewed evidence that the games measure the constructs they claim they do. Arguably, the tools have their use for matching. But the construct-validity question is mostly left unexamined in the open literature. This project takes that question seriously on a well-understood task.
Behavioral measurement is attractive in the first place because self-report generally predicts behavior poorly. Frey et al. (2017) applied 39 risk-taking measures to more than 1,500 adults and found that self-report measures cohere into a reliable general factor of risk preference, while behavioral tasks load onto it only weakly. The questionnaires agree with one another. However, they do not agree with behavior. In addition, the behavioral tasks do not agree well with each other either (Pedroni et al., 2017). A well-built behavioral task could capture something the questionnaires cannot, which is exactly what a matching context would want.
The task chosen for the study is the Balloon Analogue Risk Task (BART). However, the standard task has limitations in establishing a clear connection between the risks participants take and the rewards they subsequently earn. We argue that when the act of risk-taking is not evaluated within an ecologically rational context, it becomes difficult to observe any specific behavioral disposition beyond diffused tendencies. The main part of the project was redesigning the standard task. The redesigned task with an accompanying scoring engine introduces behavioral metrics that are referenced to an optimal behavior that maximizes the expected outcome.
The approach was deliberately exploratory and data-first. The first priority was to develop a pipeline that collects clean, robust, event-level data at scale. The second was to analyze the data with modern data-science and machine-learning frameworks, beginning with unsupervised clustering techniques to see if any non-linear correlations surface. The point was to let the structure in the data speak, with no prior commitment to any self-report domain. The question was clear. Given a well-built task and a rich dataset, what, if anything, does the data reveal about who performs well?
One finding stood out, and it was a surprising one. Across the analyses, the self-report domain that aligned with superior task performance and calibrated risk-taking was not the financial domain. It was the social domain. This was an exploratory result, discovered in the data rather than predicted in advance, and it is presented as such throughout. It was then probed for robustness with several independent methods and tested once against a larger external dataset. Why the self-reported social domain behaves this way in our observation remains an open question, and it is taken up with caution in the discussion. The result is interesting precisely because it was unexpected.
Methods
The project centers on a redesign of a standard instrument. In the Balloon Analogue Risk Task (BART; Lejuez et al., 2002), a participant inflates a virtual balloon one pump at a time. Each pump adds a small reward, but the balloon may burst at any moment, and a burst forfeits that balloon’s earnings. Thus the decision is intuitive. Either you keep pumping for a larger reward, or bank what has accumulated.
What the standard task measures, and its limit here
Under its conventional parameterization, the expected-value-optimal strategy is to pump roughly 64 times on the highest-capacity balloon, while participants stop systematically earlier. This gap is not a defect; it is a valid index of risk aversion. The limitation that matters here is narrower. Because the optimum is rarely approached on average, behavioral risk-magnitude and earnings are nearly collinear. So, the task cannot separate calibration from gross exposure. The redesign is therefore an extension of utility measurement to changing environments.
The redesign: a reachable optimum
The central change targets the hazard structure. Instead of a flat baseline burst probability, the probability of bursting rises linearly with each pump, P(burst at pump k) = k/N, where N is the balloon’s maximum capacity.
This mechanism’s design is rooted in the concept that risk-taking is not about predicting a fixed future state. Instead, we argue that risk-taking is better modeled as continuous adaptation to new information. Pursuing a larger reward requires pumping further, which raises the per-pump hazard the participant faces. This approach lowers the optimal stopping point from 64 to an attainable value, and a short derivation shows what that value is. Writing the survival probability for reaching pump k without bursting, and approximating it for large N, S(k) = ∏(i=1..k) (1 − i/N) ≈ exp(−Σ(i=1..k) i/N) ≈ exp(−k²/2N), the expected value of stopping at pump k (one reward unit per pump) is E[V(k)] = k S(k) = k exp(−k²/2N). Setting the derivative to zero gives d/dk [k exp(−k²/2N)] = (1 − k²/N) exp(−k²/2N) = 0 ⟹ k* = √N.
The optimal stop is therefore approximately the square root of capacity. The three conditions (N = 128, 32, 8) have discrete optima of 11, 5, and 2 pumps. By normalizing participants’ stopping points against an optimal benchmark, the system categorizes individuals as cautious, calibrated, or risk-seeking. Furthermore, to evaluate behavioral adaptability rather than reliance on a static strategy, the task presents three distinct balloon profiles in a randomized sequence across a thirty-trial session (ten per color). This randomized ordering penalizes invariant decision-making patterns.
Each color corresponds to a different capacity N and hence to a different optimal stopping point:
- Purple: N = 128, k* ≈ 11, low hazard.
- Teal: N = 32, k* ≈ 5, medium hazard.
- Orange: N = 8, k* ≈ 2, high hazard.
Self-report instrument
After filling a demographic survey and completing the task, the participants also completed the Domain-Specific Risk-Taking scale (DOSPERT; Weber et al., 2002; Blais & Weber, 2006), which measures self-reported willingness to take risks on a 1–7 scale across six subscales: financial-gambling, financial-investment, health and safety, recreational, ethical, and social. Traditionally, the self-reported financial risk propensity is presumed to be the strongest predictor of behavior in tasks offering monetary incentives. However, our analysis approach was domain-agnostic. It utilized exploratory methods to uncover which, if any, risk domains actually reflect the behavioral patterns observed during the task.
Scoring, and the censoring choice
A scoring engine turns each session into a set of behavioral measures. The behavioral-intention metrics use collected (non-exploded) balloons only. The reason is that on a burst trial the intended stopping point is never observed. The balloon ends the trial before the participant decides to bank, so the burst count right-censors the intention instead of revealing it. Restricting to banked balloons is the standard Lejuez adjusted-score remedy. However, this choice is not free of bias. It discards exactly the trials where the most risk-seeking intentions are most likely to have been cut short, and can attenuate the upper tail. Two points bound the concern. First, the fully observed outcome metrics that carry the central claim, money earned and the explosion rate, are not affected. Second, while previous research suggests that soliciting the intended number of pumps prior to each trial provides a straightforward methodological solution (e.g., the automatic BART; Pleskac et al., 2008), we argue that this pre-commitment eliminates the continuous, dynamic calibration inherent to a sequential task. To compensate for this while preserving the task’s dynamic nature, we instead compute alternative behavioral measures, such as post-explosion sensitivity and the explosion penalty. The principal metrics the engine produces are listed on the instrument’s page.
The platform
A substantial part of the project was building the platform that supports this design. Rather than adapting existing software, the whole system was built from the ground up as a full-stack web application, available at bart.aselimyilmaz.com. It runs the task in the browser, administers the DOSPERT-30 in a Turkish adaptation, and records event-level data with precise timestamps. Processing the raw event data yields more than thirty computational metrics per participant. To protect against poor-quality data, an automated screening pipeline reviews each session for signs of bot interference or low effort, immediately flagging records that are abnormally fast or incomplete. The game client and the scoring engine are released under the MIT license on GitHub and archived on Zenodo with a citable DOI (10.5281/zenodo.20592164). The outcome is a fully functional, reusable platform that researchers can adopt without recreating the underlying architecture.
Implementation
A total of 70 participants completed the task using the same application across two different ecological settings. This pooled sample comprised an online cohort (n = 53) alongside a synchronized laboratory cohort (n = 17). While the online modality enabled remote, asynchronous participation, the laboratory condition provided a contrasting high-stakes environment. In a synchronized, in-person session, seventeen participants engaged in the task simultaneously within a tournament framework. The highest scorer received a cash payout directly matching their accumulated virtual funds. By deliberately linking task outcomes to tangible monetary rewards and reintroducing the physical presence of peers, this setup aimed to replicate the social and economic tensions that characterize real-world risk-taking.
The online and laboratory setups diverge simultaneously in rewards, supervision, and peer presence, leading to the expectation that observed behavior should fundamentally differ between them. Consequently, the study design treats modality as a confounded variable and adjusts the analysis accordingly. However, descriptive statistics comparing the two modalities yielded no significant differences. Descriptive metrics by modality channel (n = 70: lab n = 17, online n = 53), given as the lab mean and the online mean:
- Total pumps: 129.00 and 133.83.
- Explosions (count): 14.71 and 15.38.
- Explosion rate: 0.49 and 0.51.
- Risk-taking (normalized): 0.98 and 0.94.
- Money collected: 18.10 and 17.87.
- Impulsivity: 0.29 and 0.38.
- Average pumps (adjusted): 4.95 and 5.29.
- Mean latency (ms): 579.32 and 522.12.
- Total time (min): 2.46 and 2.47.
Behavioral outcomes across both channels were statistically indistinguishable on all primary metrics (all p > .10), with the main distinction being elevated variance in the online group. Due to the limited size of the laboratory sample (n = 17), these results cannot guarantee exact equivalence. Therefore, we interpret this comparability as adequate empirical grounds for pooling the samples, rather than asserting an online format successfully emulates high-stakes lab conditions.
Recruitment
Participants in the online cohort were primarily recruited face-to-face in university libraries and common areas to ensure demographic diversity, receiving a modest token of appreciation (chocolates) upon completion. The laboratory cohort was recruited over a compressed three-day campaign. This specific campaign utilized two in-person classroom announcements within the Business Administration department: one at the beginning of a Human Resources lecture, and another at the close of a Management Science lecture. In addition to the in-person announcements, a targeted email was dispatched to Industrial Engineering students the day before the session. For this laboratory cohort, the study was strategically presented as a competitive simulation with a prize pool rather than a standard survey. A major driver of successful recruitment for both groups was the short duration of the full study. Informing participants that the entire battery (demographics survey, the task, and the DOSPERT-30) reliably took less than ten minutes proved highly effective in securing their participation.
The laboratory recruitment campaign yielded 34 initial applicants. To manage the strict physical capacity of the laboratory (n = 20) against this demand, we implemented a two-step active commitment protocol for the lab cohort. Prospective participants first registered via a digital form and were subsequently required to explicitly confirm their attendance by replying to a confirmation email for reserving their seats by a strict deadline. Registrants who missed the confirmation window were rotated out, and waitlisted individuals were sequentially invited to fill the open seats. Of the 20 participants who formally secured a spot through this process, 16 attended the synchronized session, alongside one unconfirmed walk-in, yielding a final laboratory cohort of n = 17. Finally, the remaining applicants who could not be accommodated in the physical lab were redirected to the online iteration of the task.
Personalized debriefing (engagement only)
The primary recruitment incentive was a personalized behavioral debriefing. Upon completing the task, participants received an automated, narrative reflection of their risk profile derived directly from their in-game telemetry. This feature functioned strictly as an engagement tool rather than a validated psychometric instrument. Its underlying heuristics are exploratory and fully documented within the software repository. Nevertheless, participant reception to this feedback was positive, possibly reflecting a sense of reciprocity.
Ethics
The study was reviewed and approved by the METU Human Subjects Ethics Committee (protocol 0176-ODTÜİAEK-2026, 16 April 2026). All participants gave informed consent before taking part, and the remote sessions additionally passed the quality checks described above.
Results and discussion
To explore the data structure, we first applied unsupervised clustering algorithms to the behavioral metrics to extract reproducible clusters representing potential behavioral archetypes. We then trained a random forest classifier to predict cluster membership based exclusively on participants’ DOSPERT scores. We then evaluated the model with the permutation importance method, which ranks each self-report domain by how much prediction accuracy drops when that domain’s scores are shuffled, to see which domains the classifier actually relied on. While overall accuracy and cluster stability prevented us from making robust predictive generalizations, the feature importance rankings offered valuable exploratory insight. The self-report subscale that tracked profitable, well-calibrated performance was not the financial subscale. It was the social subscale.
Recognizing that no single estimator should carry the full analytical weight given the sample size, we triangulated this exploratory signal using three methods that fail in different ways so that agreement across them is harder to explain as one method’s artifact. The same hierarchy of associations emerged consistently across all approaches.
The behavioral profile
Participants reporting high social risk propensities did not exhibit indiscriminate pumping behavior with excessive hazard exposure. Instead, they consistently terminated trials near the expected-value optimum on average. Social risk propensity correlated strongly with total earnings but only weakly with explosion rates. The domain therefore signaled a profile of strategic task performance rather than mere hazard exposure.
Canonical correlation
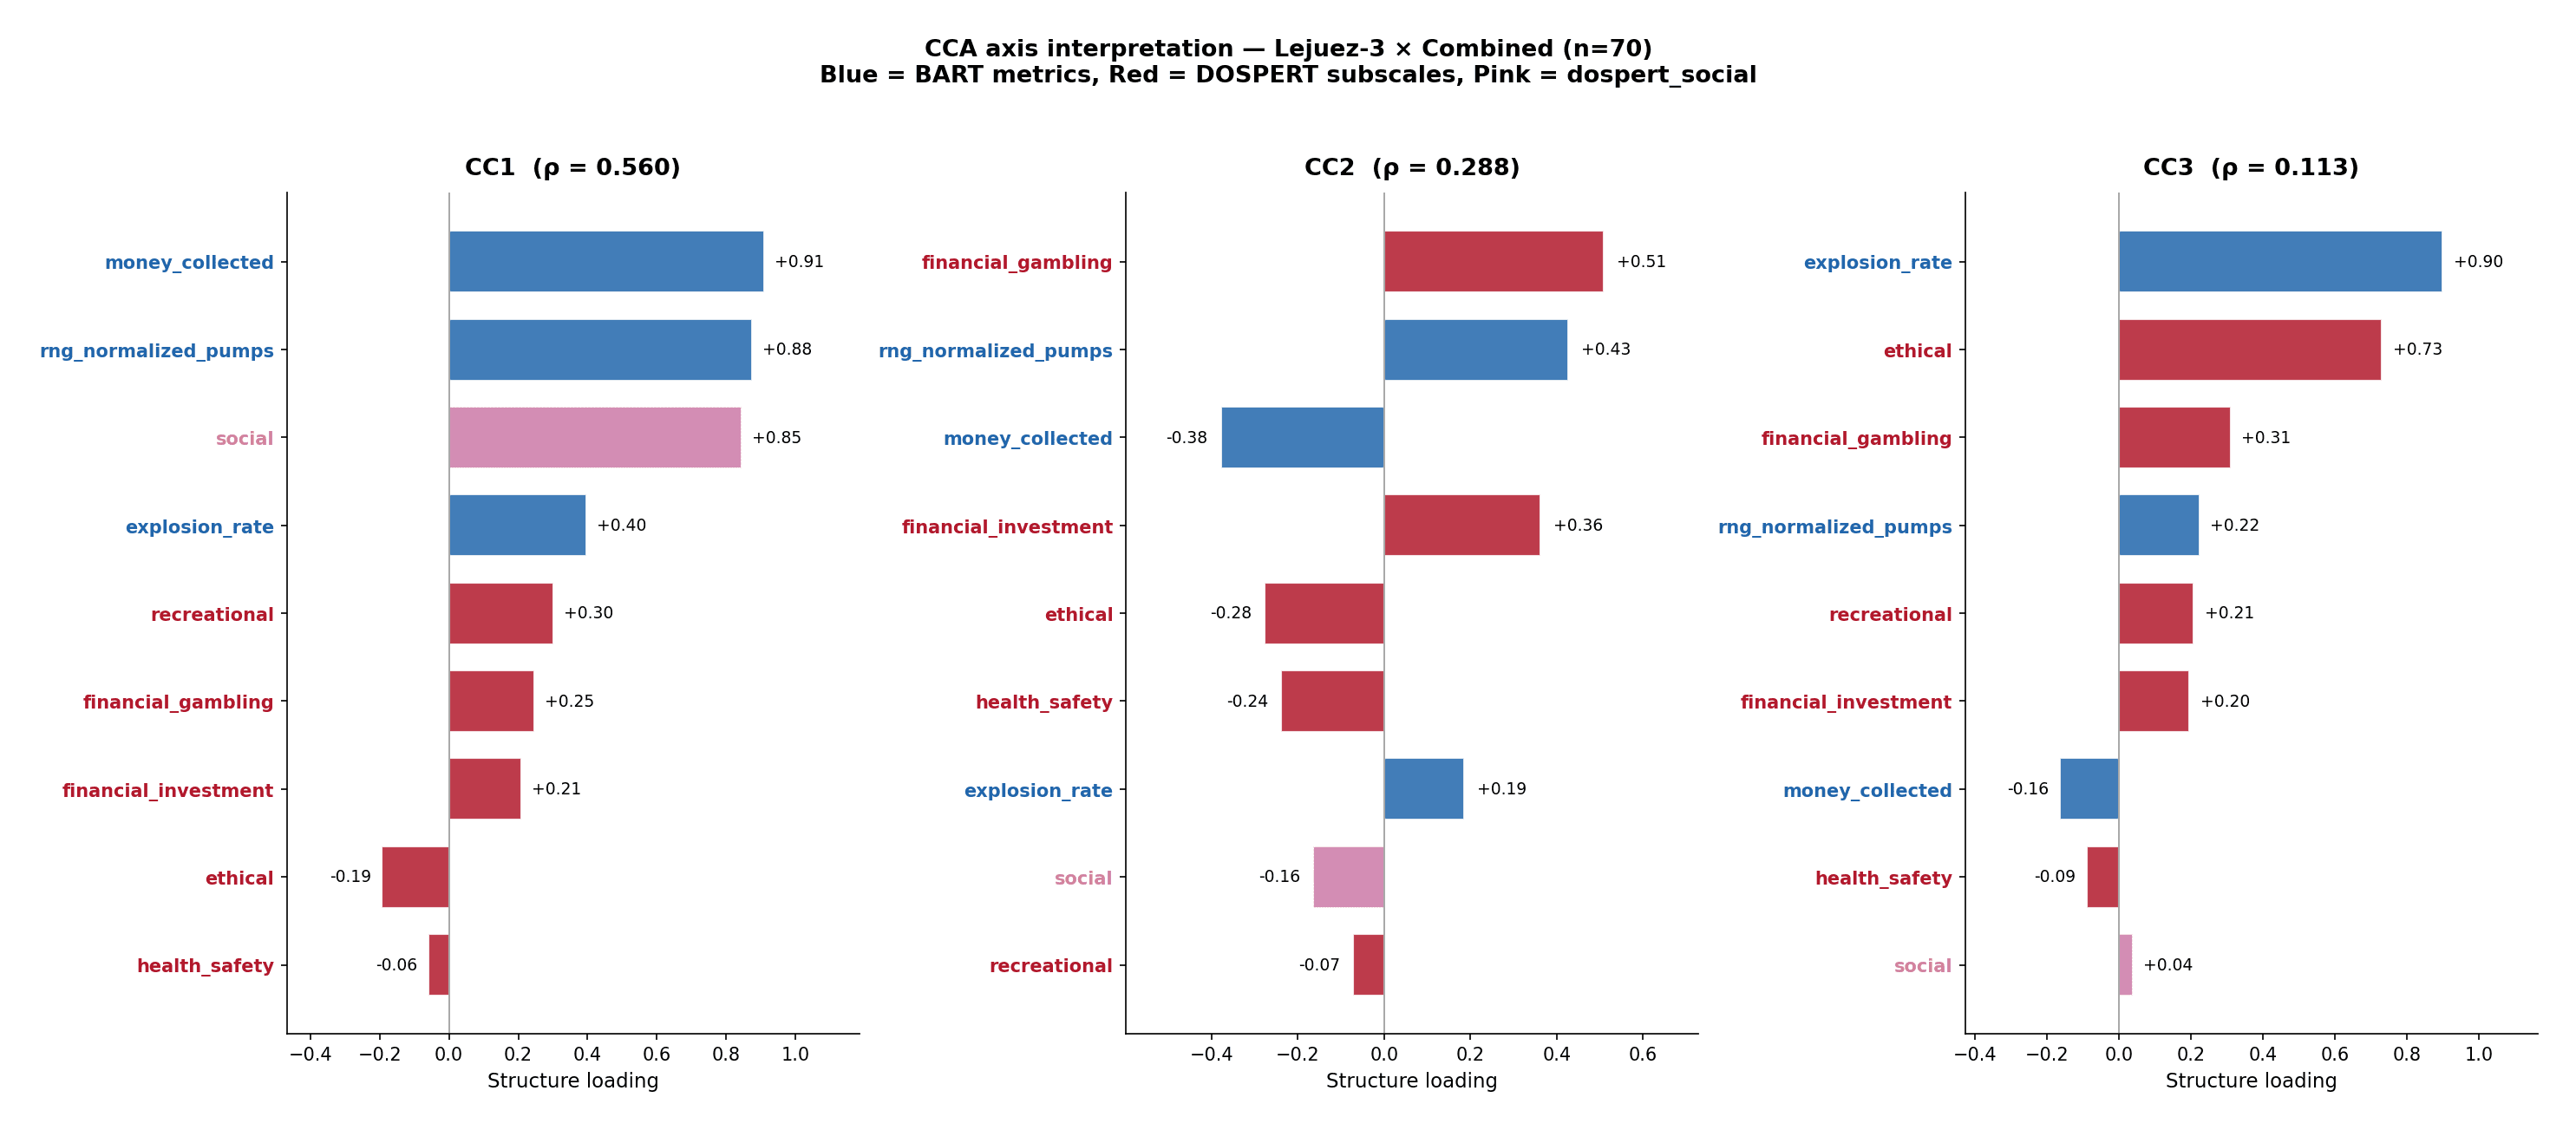
Canonical correlation finds the single weighted combination of self-report scores that most strongly tracks a single weighted combination of behavior metrics. To maintain a defensible observation-to-variable ratio at n = 70, our approach relies on a subset of three established Lejuez et al. (2002) risk metrics: normalized pumps, explosion rate, and money collected. The first canonical correlation yields ρ = 0.56, where the social subscale loads heavily (+0.85) on the primary behavioral axis. The financial-gambling domain remains present but is relegated to the secondary axis (CC2), aligning with the conventional convergent-validity dimension. Although including a broader battery of descriptors would yield a higher correlation, it would do so only by overfitting. The dominance of the social subscale increases when descriptive variables are removed, which is the exact opposite of what an overfitting artifact would produce.
Regularized Bayesian estimation
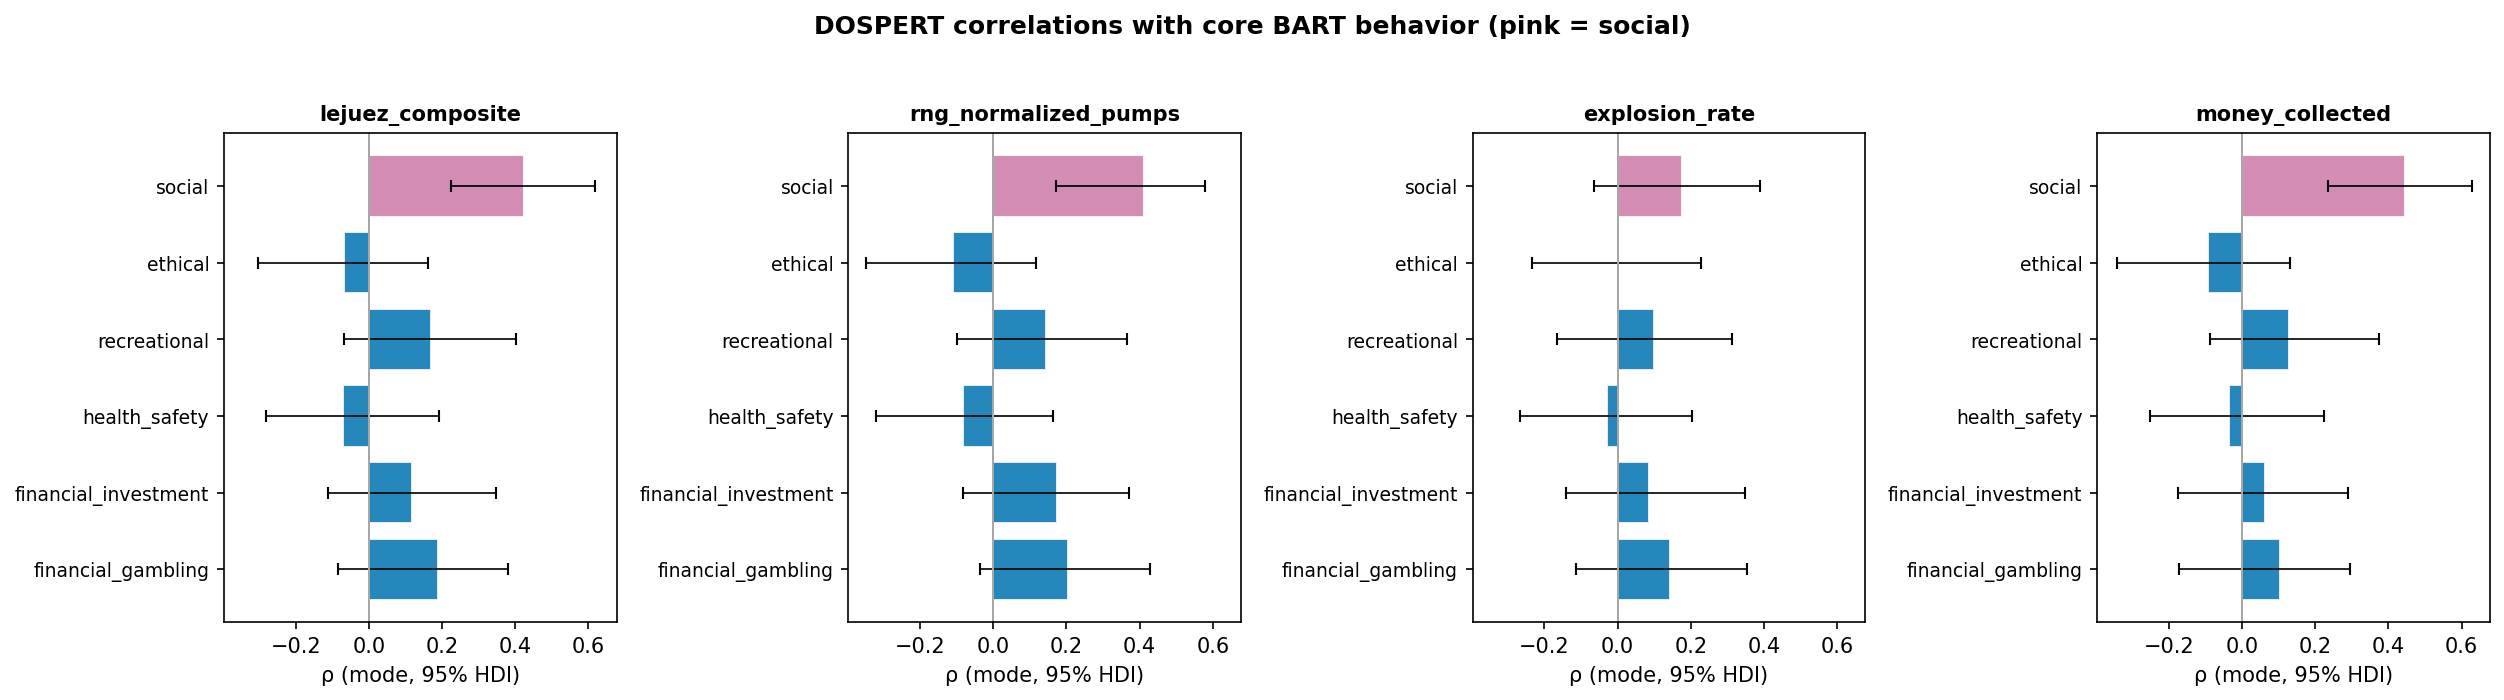
To insulate the findings against sampling noise at small n, we cross-validated the relationships using a regularized Bayesian framework modeled after Frey et al. (2017). Following their protocol, one degenerate binary metric was omitted, and all estimates were checked to ensure stable model convergence. We report each estimate as a 95% Highest Density Interval (HDI) that represents the range the parameter most plausibly occupies. An interval excluding zero therefore signals a credibly non-zero effect. The analysis confirms that social is the singular subscale whose HDI excludes zero, both as a zero-order correlate of composite behavior (M = 0.43, HDI [0.23, 0.62]) and as a partial predictor (β = 0.45, HDI [0.22, 0.69]). All intervals for financial-gambling straddle zero (M = 0.19, HDI [−0.08, 0.38]). This social specificity is resilient to demographic and modality controls (β = 0.42, HDI [0.21, 0.68]).
Factor analysis and robustness
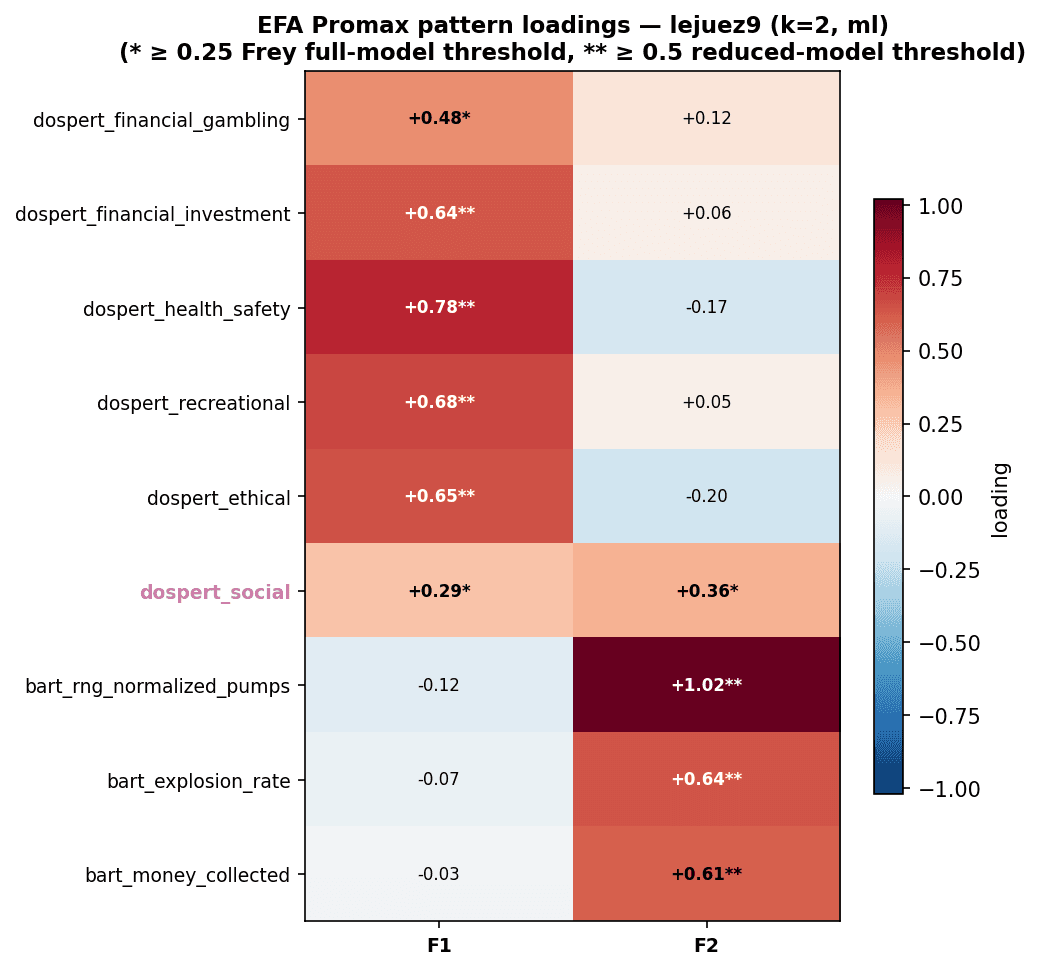
We used exploratory factor analysis, which groups correlated variables into a few underlying factors and lets those factors themselves be correlated. This approach yielded structurally identical conclusions. The inter-factor correlation is only ϕ = 0.25, reflecting the familiar self-report/behavior divide. Social is the only DOSPERT subscale that meaningfully loads on the behavioral factor (λ = 0.36; all others fall below 0.25). A leave-one-out reanalysis demonstrates that this result is not driven by any single extreme participant: the social domain maintains its top-ranked cross-loading on the behavioral factor in all seventy folds.
Addressing the modality confound
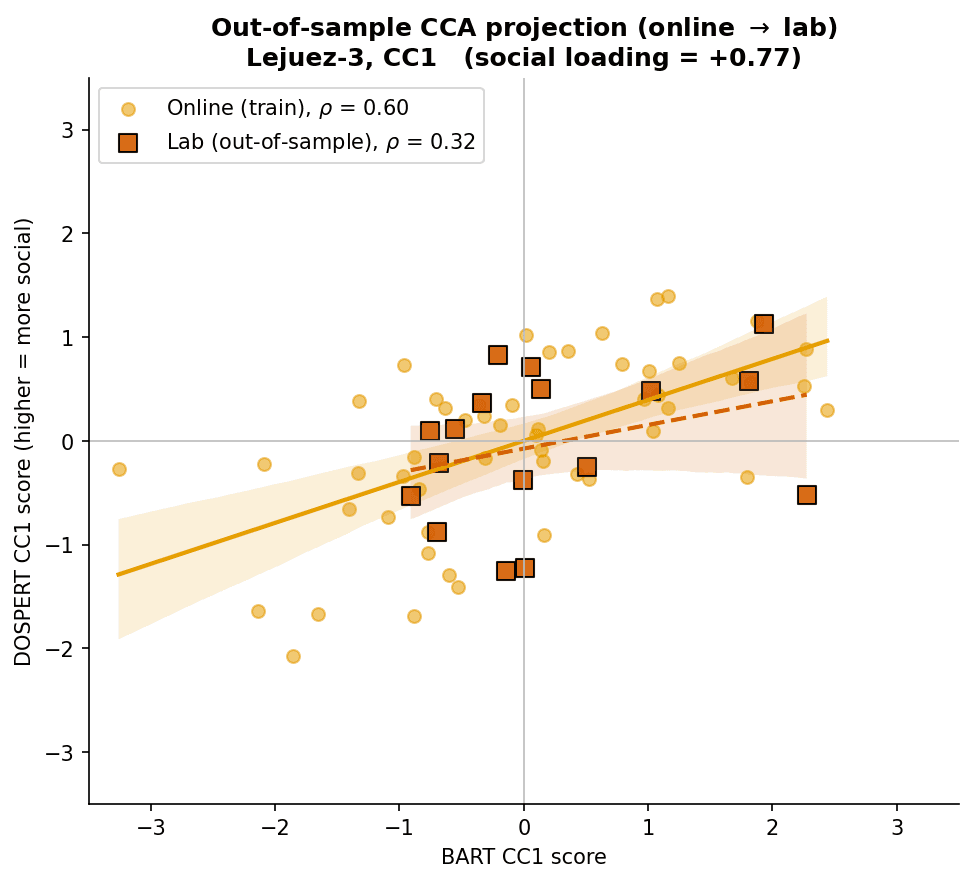
The identified relationships are not an artifact of pooling the two cohorts. In the online cohort alone the core three-metric result replicates and is arguably stronger (ρ = 0.60, social loading +0.77). The laboratory cohort (n = 17) is too small for independent multivariate inference. With only seventeen observations, its canonical correlation is mathematically forced toward 1.0, rendering the loadings uninterpretable. Instead, we utilized an out-of-sample projection by learning the canonical weights on the online cohort and projecting the laboratory cohort through them. This yields a weaker but still positive correlation (ρ = 0.32), consistent with a genuine effect that is naturally attenuated by the shift in experimental modality.
A pre-registered external test
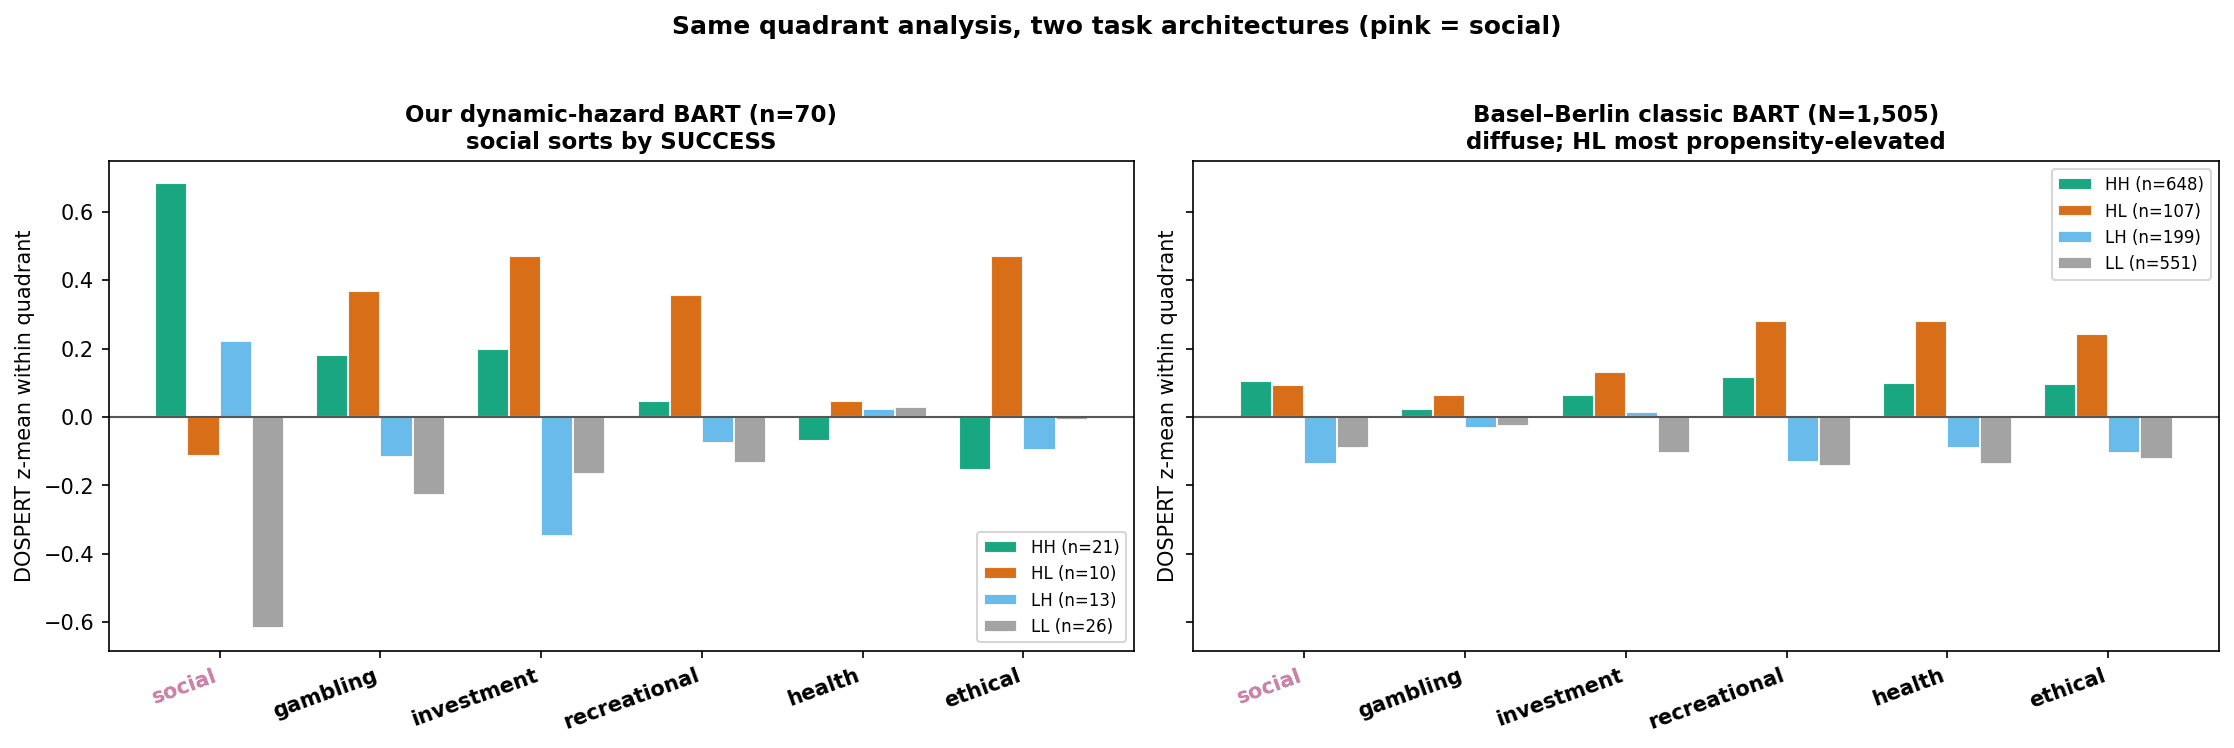
To test generalizability, the prediction was frozen in a pre-registration and run once against a large, openly available dataset, the Basel–Berlin Risk Study (Frey et al., 2017), with N = 1,505 scorable participants. The foundational association between the social domain and behavior successfully replicated, with an expected attenuation (ρ = 0.115, HDI [0.062, 0.166]). Furthermore, the rank ordering of the social domain over financial-gambling was preserved with nearly identical posterior certainty (0.957 compared to our 0.960). However, the distinct dominance of the social signal failed to replicate. Within the applied version of the standard BART and only 128-capacity balloons, the predictive signal fragments. Recreational risk becomes the primary driver, and the social domain drops to fourth out of six. A fair assessment is that while the underlying association is robust across datasets, its dominant role relies heavily on the specific task. This establishes a clear boundary condition for our exploratory claims regarding social specificity.
Why the task design matters
The boundary condition observed in the external dataset stems directly from this difference in task architecture. In our dynamic-hazard task, the separation between calibration and gross exposure is what makes the social signal visible. To illustrate this, we classify participants into performance quadrants based on behavioral risk (normalized pumps) and success (returns). For the dynamic-hazard task, we define high and low risk relative to the theoretical optimal stopping point, calculated for maximum expected value. Here, pump volume and earnings correlate at only r = 0.60. Because over-pumping past the theoretical optimum is heavily penalized, earnings reward calibrated stopping, not gross exposure. The part of a participant’s earnings that risk-magnitude cannot explain tracks the social domain specifically.
The 128-capacity, single-balloon architecture of the classic static task allows no such separation. Because participants severely under-pump relative to the mathematical optimum, we were forced to use the empirical cohort mean as the reference point for high and low risk comparison. In this restricted behavioral range, risk and success are nearly collinear (r ≈ 0.92), and any success score mechanically collapses into gross exposure.
Interpretation, held with caution
The mechanism underlying this social correlation remains open. A correlation between self-reported tolerance for social friction and calibrated stopping does not establish shared neurocognitive machinery, let alone an evolutionary origin. One candidate framework emerges from social-evaluation theory. A substantial literature treats the need to belong as a fundamental motivation (Baumeister & Leary, 1995) and posits an internal monitor of social standing (Leary et al., 1995; Slavich, 2020). Under this view, tolerance for social risk and the patience to hold a strategy under adverse feedback might draw on a shared regulatory capacity, as both require the individual to absorb immediate negative feedback in pursuit of longer-run gains.
Furthermore, risk-taking rarely occurs in a cognitive vacuum. Most real-world decision-making implicitly involves a social presence. Financial speculation, such as betting on a stock, is fundamentally a bet on the anticipated consensus of others. Similarly, entrepreneurial ventures require an individual to actively navigate public perception. These realities suggest that broad social constructs and cultural values are connected with individual risk attitudes. While this framework is theoretically attractive, more frugal accounts cannot be ruled out. Higher generalized self-efficacy, lower trait anxiety, or simply heightened task engagement would each support the same behavioral patience. Ultimately, disentangling these competing accounts will require a dedicated construct-validity battery specifically designed to test these intuitions.
Ecological validity and bounded constraints
Our methodological approach sought to capture these dynamics by increasing the realistic ecology of the task. We engineered the digital task where the hazard rate carried the true probabilistic weight of each successive pump. By utilizing client-side state tracking, we ensured that explosion events were mathematically stochastic rather than predetermined. Furthermore, the laboratory protocol was framed to evoke the stakes of a competitive environment.
However, the whole design is also bounded by limitations. Assuming that sequential decision-making is path-dependent, a participant’s specific action at any given moment may have been influenced by a multitude of variables. Even within a structured laboratory setup, transient factors such as temperature or humidity, as well as fluctuating physiological states, remain uncontrolled. Capturing this full spectrum of continuous variance remains a persistent challenge.
Limitations
Several methodological constraints weaken our exploratory findings. First, the current sample is modest (n = 70) and exploratory, lacking a held-out confirmatory dataset to validate the proposed task. Even though statistical stress testing strengthens the validity of the exploration, it is still an observation within the existing sample. Generalizability is restricted by a culturally homogeneous sample, as well as a structural confound. The lab and online cohorts differed in both their physical settings and financial incentives. Hence, we cannot perfectly isolate the influence of each. While the convergence observed across varying estimators provides internal reliability, it cannot substitute for independent external validation. A critical next step would be a pre-registered replication featuring an expanded sample (n ≥ 150) and a construct-validity battery. We tried to mitigate the mentioned limitations by using out-of-sample projection methods, alongside a replication of the construct on another external dataset. Beyond standard replication, the platform’s granular event-level telemetry offers a promising avenue for future methodological work. Because individual pumps and consequent actions are precisely timestamped, subsequent analyses can move past session-level summaries to employ sequential modeling. While training predictive frameworks to forecast participant behavior on a trial-by-trial basis exceeds the scope of the present exploratory study, the task’s temporal dynamics provide the necessary architecture for testing these sequential effects.
Closing
For decades, the gap between stated and elicited risk-taking has been interpreted as evidence that behavioral tasks are unreliable. This project suggests a more constructive reading. The association is likely present, but harder to detect. Beyond this, the contribution of this work also lies in the process of its construction. Its motivation is in part personal, arising from the difficulty of identifying one’s genuine aptitudes within rigid institutional structures that offer little guidance in doing so. The project concludes with the concrete result of that effort: a reusable, open-source platform and an accompanying procedure for measuring risk-taking dispositions. The instrument makes no claim to resolve those broader structural limitations. It is offered, more modestly, in the hope that more direct measures of how individuals behave might prove a useful starting point.
Selected references
- Baumeister, R. F., & Leary, M. R. (1995). The need to belong: Desire for interpersonal attachments as a fundamental human motivation. Psychological Bulletin, 117(3), 497–529.
- Blais, A.-R., & Weber, E. U. (2006). A domain-specific risk-taking (DOSPERT) scale for adult populations. Judgment and Decision Making, 1(1), 33–47.
- Compagne, C., Teti Mayer, J., Gabriel, D., Comte, A., Magnin, E., Bennabi, D., & Tannou, T. (2023). Adaptations of the balloon analog risk task for neuroimaging settings: a systematic review. Frontiers in Neuroscience, 17, 1237734.
- Frey, R., Pedroni, A., Mata, R., Rieskamp, J., & Hertwig, R. (2017). Risk preference shares the psychometric structure of major psychological traits. Science Advances, 3(10), e1701381.
- Leary, M. R., Tambor, E. S., Terdal, S. K., & Downs, D. L. (1995). Self-esteem as an interpersonal monitor: The sociometer hypothesis. Journal of Personality and Social Psychology, 68(3), 518–530.
- Lejuez, C. W., Read, J. P., Kahler, C. W., Richards, J. B., Ramsey, S. E., Stuart, G. L., Strong, D. R., & Brown, R. A. (2002). Evaluation of a behavioral measure of risk taking: The Balloon Analogue Risk Task (BART). Journal of Experimental Psychology: Applied, 8(2), 75–84.
- Pedroni, A., Frey, R., Bruhin, A., Dutilh, G., Hertwig, R., & Rieskamp, J. (2017). The risk elicitation puzzle. Nature Human Behaviour, 1(11), 803–809.
- Pleskac, T. J., Wallsten, T. S., Wang, P., & Lejuez, C. W. (2008). Development of an automatic response mode to improve the clinical utility of sequential risk-taking tasks. Experimental and Clinical Psychopharmacology, 16(6), 555–564.
- Slavich, G. M. (2020). Social Safety Theory: A biologically based evolutionary perspective on life stress, health, and behavior. Annual Review of Clinical Psychology, 16, 265–295.
- Weber, E. U., Blais, A.-R., & Betz, N. E. (2002). A domain-specific risk-attitude scale: Measuring risk perceptions and risk behaviors. Journal of Behavioral Decision Making, 15(4), 263–290.
- Yılmaz, A. S. (2026). Dynamic Hazard Rate BART: A multi-risk Balloon Analogue Risk Task (v0.1.2). Zenodo. https://doi.org/10.5281/zenodo.20592164